Listing Performance: Smarter Tracking, Analysis, and Export (Updated 1 April 2026)
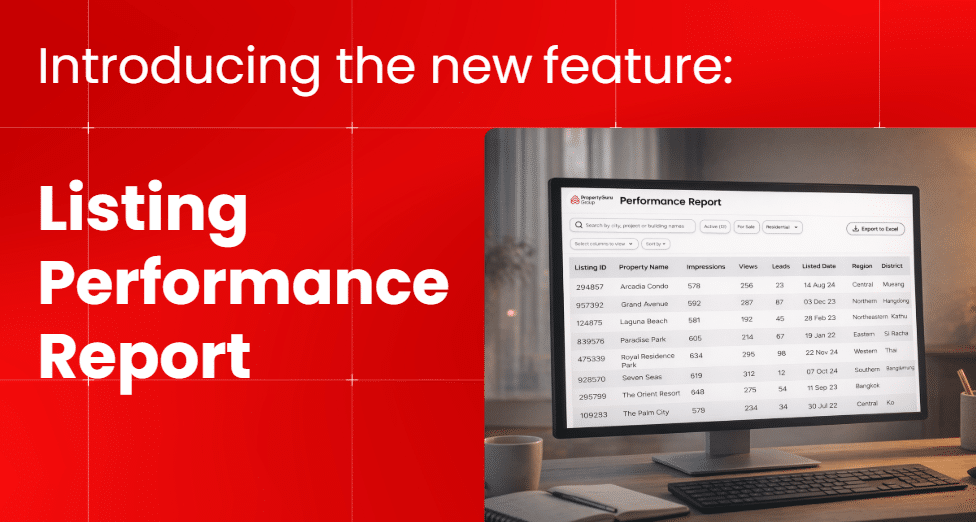
Easily monitor and improve your listing performance with a clearer, more flexible view of your data—all in one place.
With the enhanced Listing Performance feature, you can track key metrics, analyse all your listings, and export data for further use—helping you understand what works and continuously optimise your listings.
You can:
- Track Impressions, Views, and Leads for each listing
- View all listings in one place
- Search, filter, and sort data
- Customise your view based on your needs
- Export your data to Excel for reporting and analysis
All performance data is shown as cumulative, from the listing’s publish date up to the present.
View Your Listings (Mobile & Desktop)
This feature is available on both mobile and desktop, with layouts optimised for each device. While the display differs, all functionalities remain the same.
Mobile View
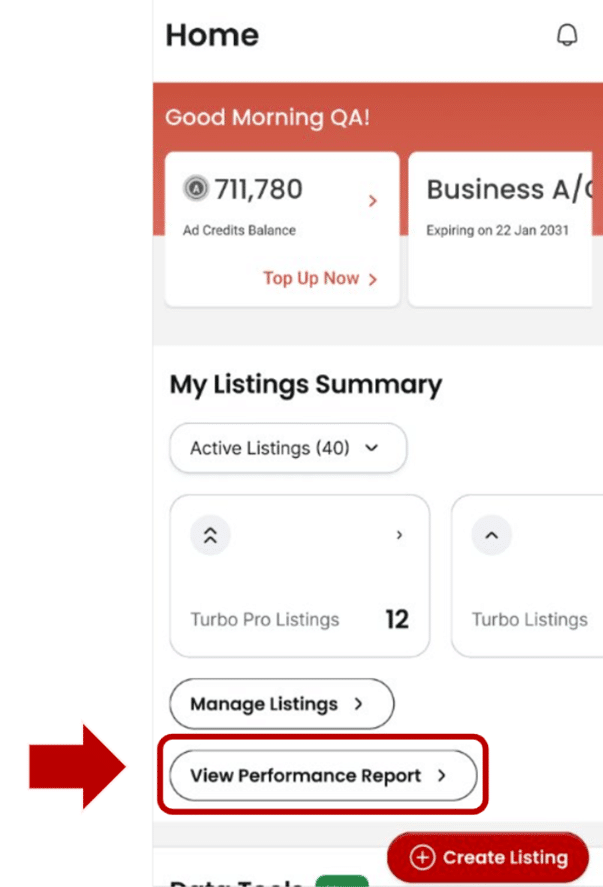
How to Access
On the dashboard, you will find a button “View Performance Report” that allows you to view your listing performance report. You can click here to access your listing performance directly.
What You See
Your listings are displayed in a Card View, making it easy to quickly scan performance.
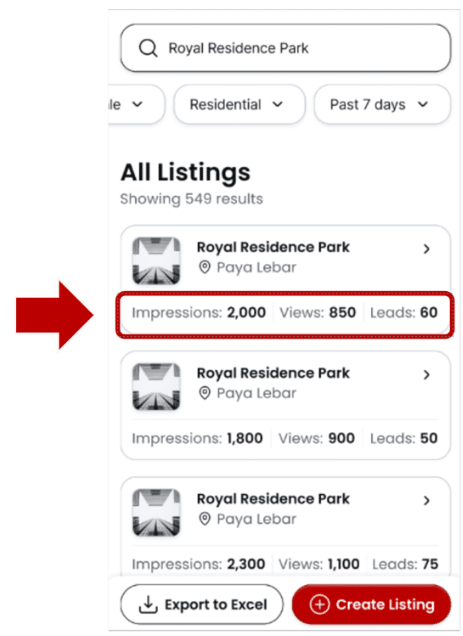
Each card shows key metrics:
- Impressions – Number of times your listing is shown
- Views – Number of visits to your listing
- Leads – Number of enquiries received
What You Can Do
- View Listing Details
Tap on any card to view more details about the listing.
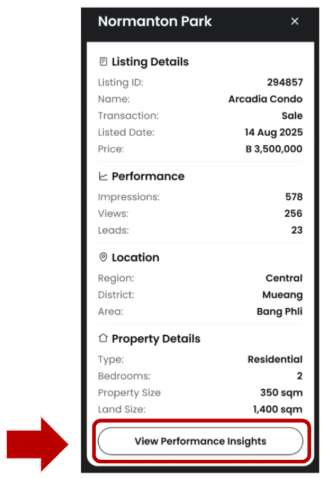
You can view:
- Listing ID
- Property Name
- Impressions / Views / Leads
- Listed Date
- Location (Region / District / Area)
- Property Type
- Price
- Size / Land Size
- Bedrooms
You can also tap “View Performance Insights” to access the full performance page.
Search listings by keyword
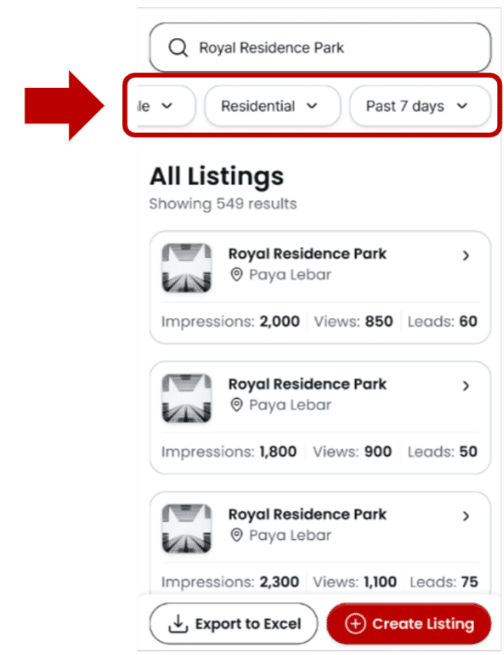
Filter by:
- Listing Status
- Listing Type (Sale / Rent)
- Property Type
- Listing Duration (e.g. last 7 days or custom date range)
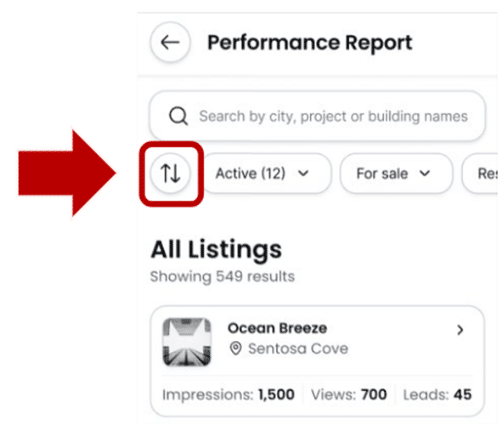
Customize & Sort
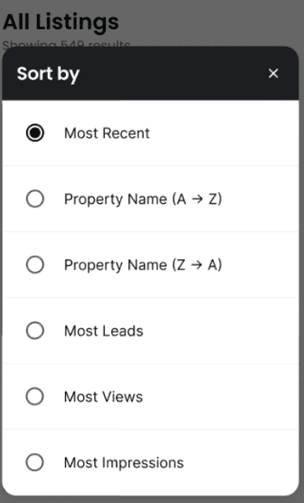
- Sort data based on your preference
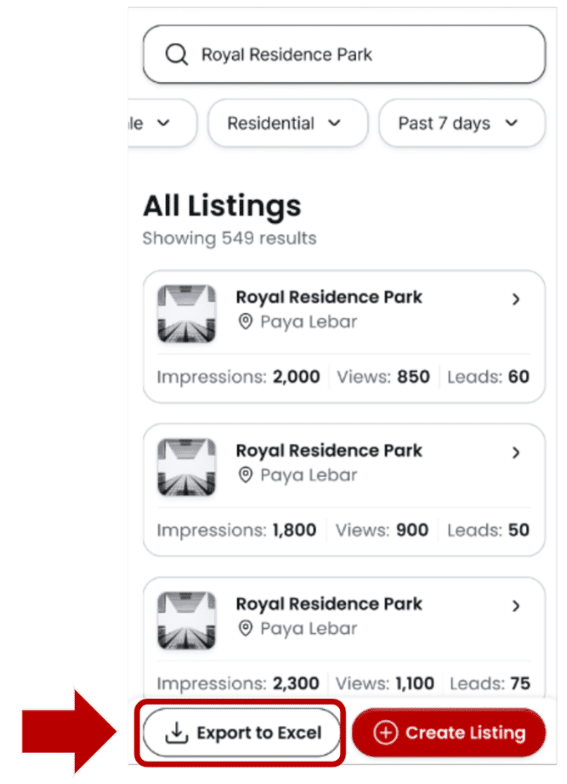
Export Data
Download performance data for multiple listings by tapping the “Export to Excel” button.
Desktop View
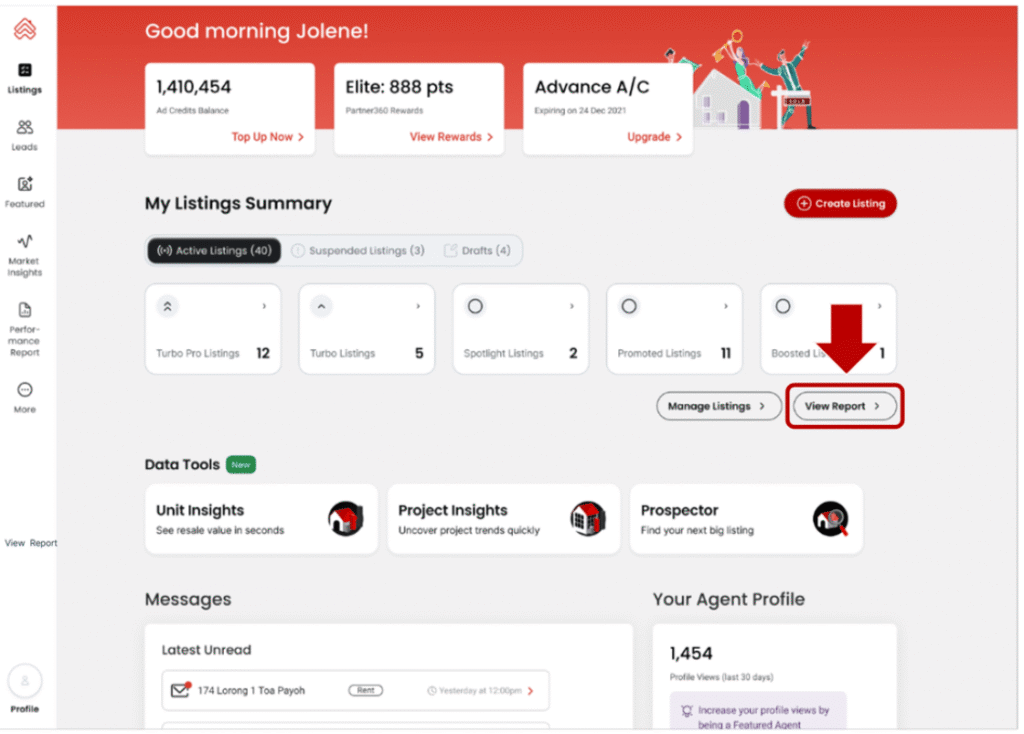
How to Access
On the dashboard, click the “Performance Report” or “View Report” button to access your listing performance.
What You See
Your listings are displayed in a Table View, allowing you to analyse all listings on one screen.
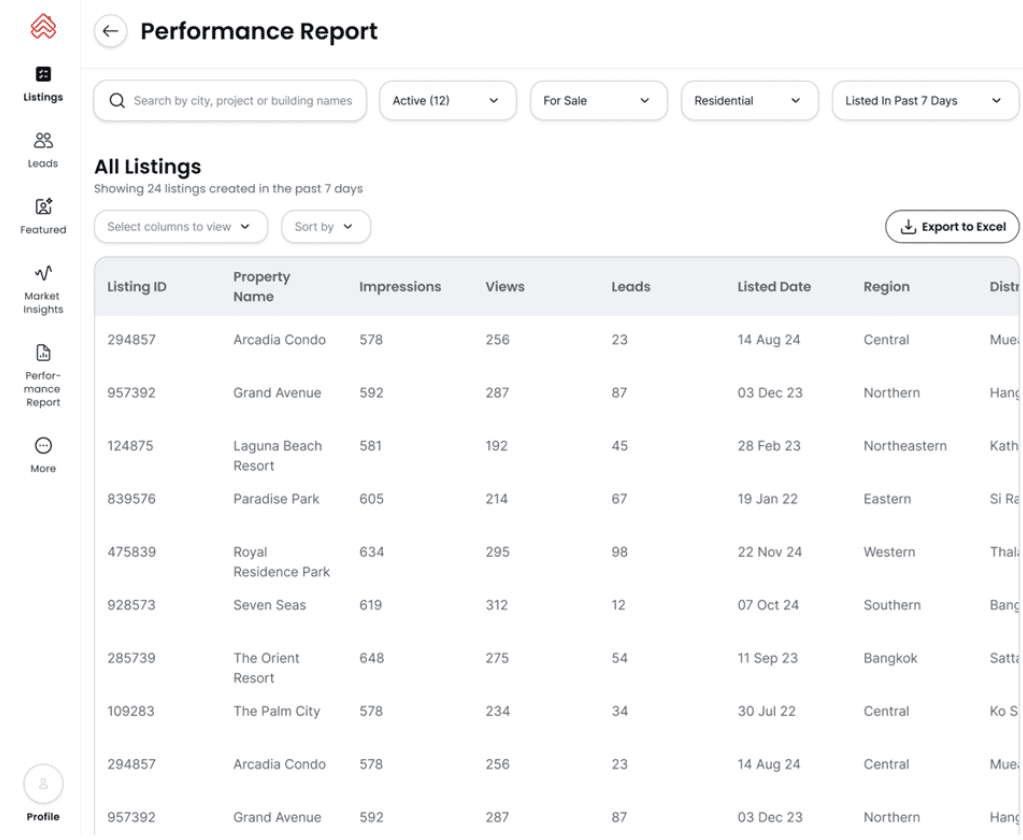
You can view key information, including:
- Listing ID
- Property Name
- Impressions / Views / Leads
- Listed Date
- Location (Region / District / Area)
- Property Type
- Price
- Size / Land Size
- Bedrooms
What You Can Do
Search & Filter Options
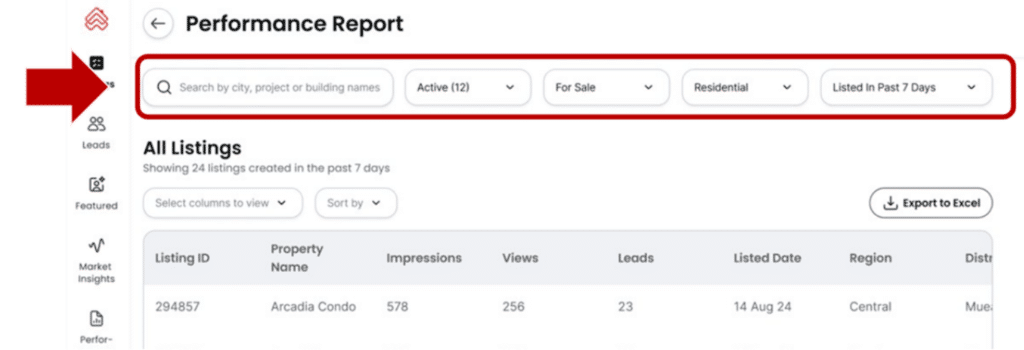
Easily find and analyse listings with flexible controls:
- Search listings by keywords
- Filter by:
- Listing Status
- Listing Type (Sale / Rent)
- Property Type
- Listing Duration (e.g. last 7 days or custom date range)
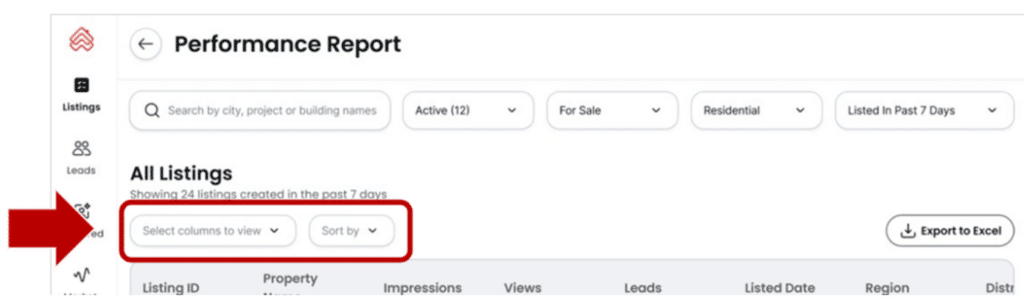
You can also:
- Customize visible columns
- Sort data based on your preference
Export to Excel
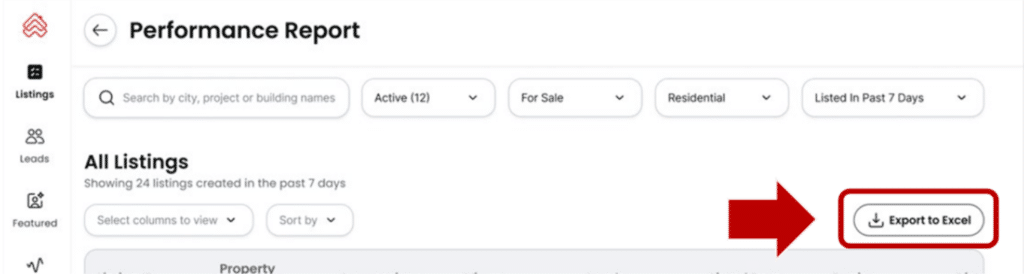
You can download your listing data as an Excel file.
- The exported file will reflect the columns you selected in Table View
- Ideal for:
- Performance analysis
- Reporting
- Comparing listings
Summary
With this update, you can now easily track, analyze, and export your listing performance in one place—across both mobile and desktop.
Use these insights to continuously optimise your listings and improve results. You can also boost visibility instantly with tools like Featured Agent, Turbo, or Boost.
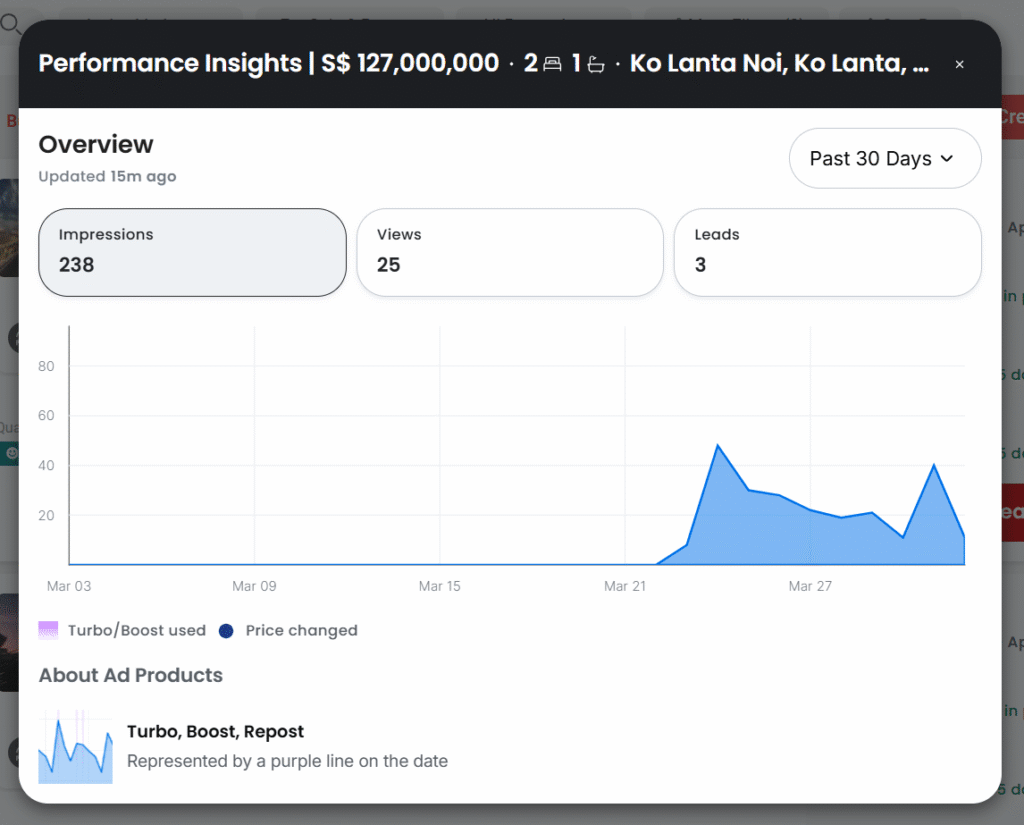
Sneak Peek: Deeper Listing Performance Insights Coming Soon
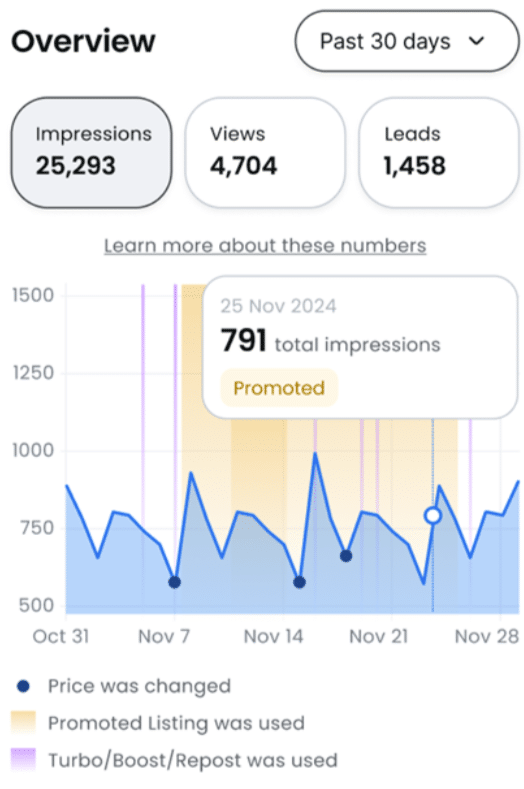
Coming soon, you will be able to dive deeper into your listing performance with an interactive graph. Simply click on any point in the chart to see what actions were taken on your listing—such as Boosts, Reposts, or price changes—and how they impacted your Impressions, Views, and Leads. This helps you understand better what works and optimise your strategy more effectively.
If you have any questions or need further assistance, please contact our Customer Service team:
Phone: 02-204-9555 (Monday – Friday, 09:00 – 18:00, excluding public holidays)
Email: support@ddproperty.com
Line: @ddproperty
Read Previous